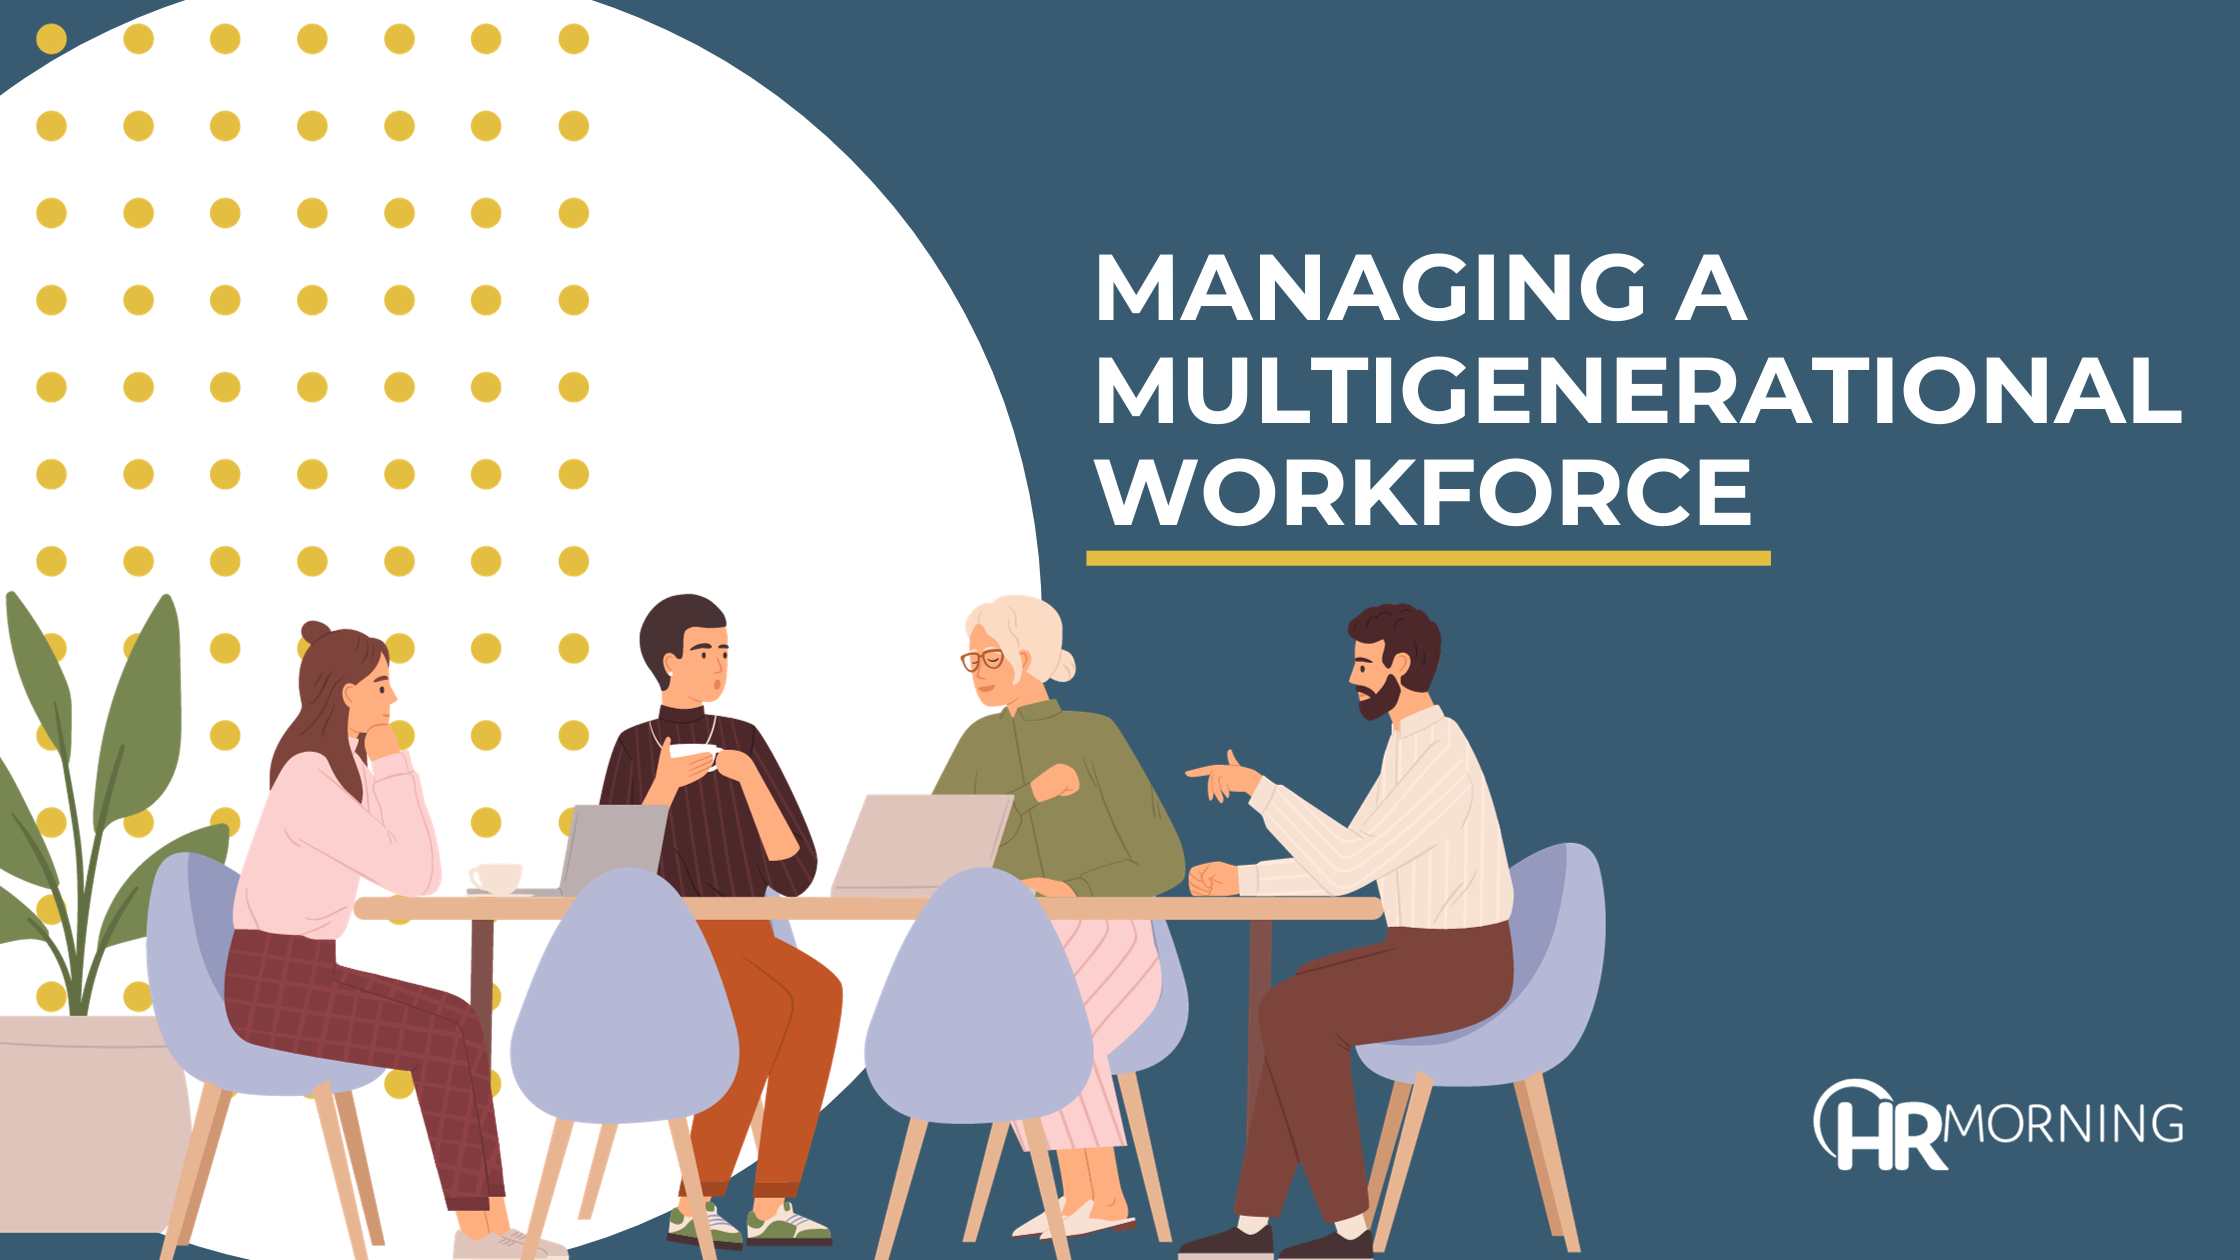
In the last 10 years, women’s wages, as a percentage of men’s, have increased in most age groups, but women in some groups have done better than others.
The U.S. Bureau of Labor Statistics produced data showing in 2008, women who were full-time wage and salary workers had median weekly earnings that were about 80% of the median for their male counterparts. Median weekly wages were $638 for women, $798 for men. In 1979, women earned about 62% of what men made.
Here’s a percentage comparison to men between ’79 and ’08, by typical age groups in the workforce:
- Age 20-24: ’79 — women made 61% of what men made; ’08 — women made 80% of what men made
- 25-34: ’79 — 68%; ’08 — 88%
- 35-44: ’79 — 58%; ’08 — 77%
- 45-54: ’79 — 57%; ’08 — 77%
- 55-64: ’79 — 60%; ’08 — 78%
Clearly, women who work in in entry-level positions that typically go to workers under age 25 come the closest — 88% — to equaling the pay of their male counterparts. In most other age groups, women make about three-quarters of what male counterparts make.
Apart from the cold numbers, there’s the big question: Even with the gains, women still make less. Why?
Some of course will point to sex discrimination. Others will say it’s because women more often than men drop out in mid- or early-career to raise children, and then have to play catch-up later on.
For whatever reason, the gap exists.
To see the full BLS report, “Highlights of Women’s Earnings 2008,” go here.